Benchmark Increases Overall Gold Ounces by 44% and 77% in the Measured & Indicated Classification with Expanded Mineral Resource Estimate Further Derisking the Gold-Silver Project

Benchmark Metals Inc. (TSXV: BNCH) (OTCQX: BNCHF) (WKN: A2JM2X) (the “Company” or “Benchmark“) is pleased to announce a significant increase to its global bulk-tonnage Mineral Resource Estimate (MRE) for its flagship Lawyers Gold-Silver Project. The MRE comprised of 1,097 drill holes totaling 200,000 metres collectively from the Cliff Creek, AGB and Dukes Ridge deposits were used for Mineral Resource Estimation. The 100% owned Lawyers Gold-Silver Project is located within a road accessible region of the prolific Golden Horseshoe area of north-central British Columbia, Canada.
John Williamson, CEO, commented, “The expanded Mineral Resource Estimate is demonstrating the world-class potential of Benchmark’s multi-million-ounce gold-silver deposits. The Company has provided one of the highest-grade, open pitable mining projects in North America. The 2021 drill program and winter 2022 drill program has significantly de-risked the project with approximately 90 percent of the Mineral Resource within the Measured + Indicated classification. With the deposits open, further resource growth is possible and the Project has numerous targets that may develop into near mine satellite deposits. The company has drilled-out a significant amount of gold and silver ounces that is not included in the $1700 pit shell. At higher precious metals prices, the contained gold increases significantly. The MRE comprises of proven economically minable material while the remaining, outside of pit gold and silver will provide a significant opportunity as the price of precious metals increases.”
Ian Harris, VP Engineering, commented, “The Project is demonstrating potential for economic mining methods with high-grade mineralization extending from surface to depth. The higher-grade core zones at surface will have a positive impact on economics in the forthcoming Preliminary Economic Assessment (PEA). Benchmark’s drill-to-build philosophy is delivering the results to develop the Project into a world-class gold-silver mine located in one of the best mining jurisdictions in the world.”
Benchmark Metals invites you to a webinar to discuss the Mineral Resource Estimate on Tuesday, June 14th at 8 am PST, 11 am EST, and 6 pm CET. Webinar Link.
Highlights: 2022 Expanded Mineral Resource Estimate
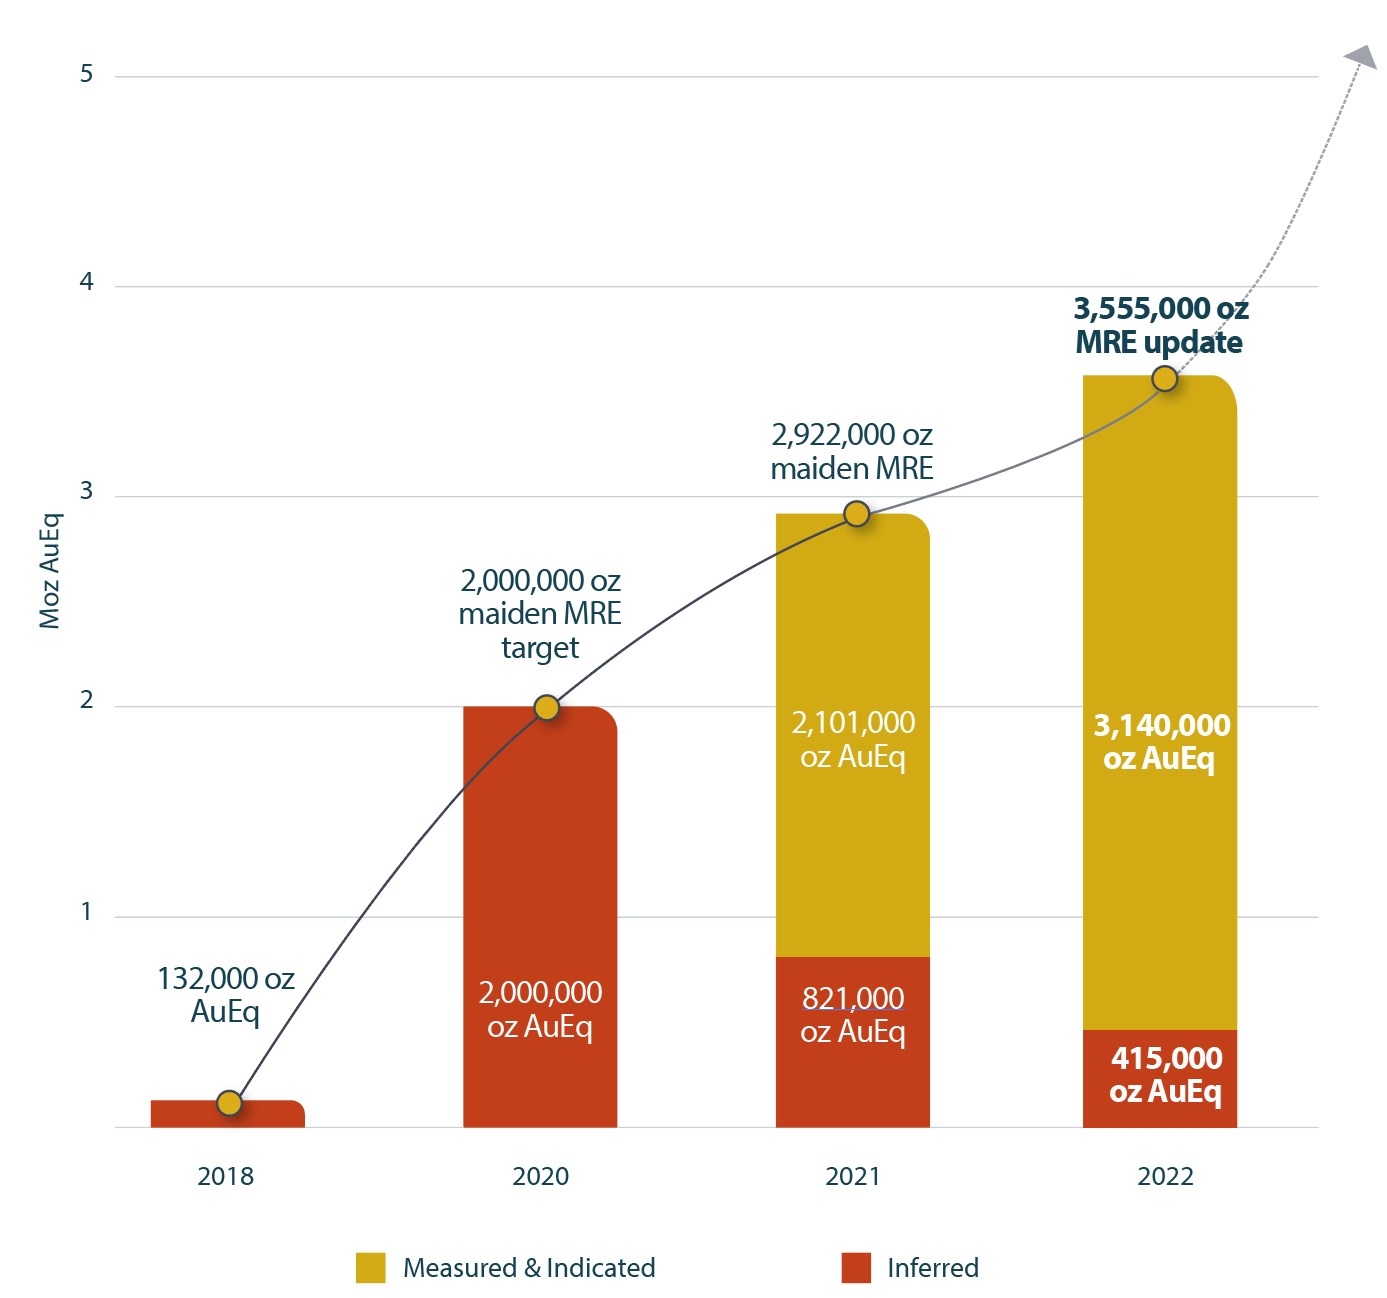
- Indicated Mineral Resource of 3.14 million ounces grading 1.45 grams per tonne (g/t) gold equivalent (AuEq), contained within 67.4 million tonnes as per Table #1;
- Inferred Mineral Resource of 415,000 ounces grading 2.63 g/t AuEq contained within 4.9 million tonnes;
- The Mineral Resource shows excellent continuity and consistency, demonstrated by increasing AuEq cut-off grades having marginal impact on the pit-constrained AuEq ounces as demonstrated in Table #2;
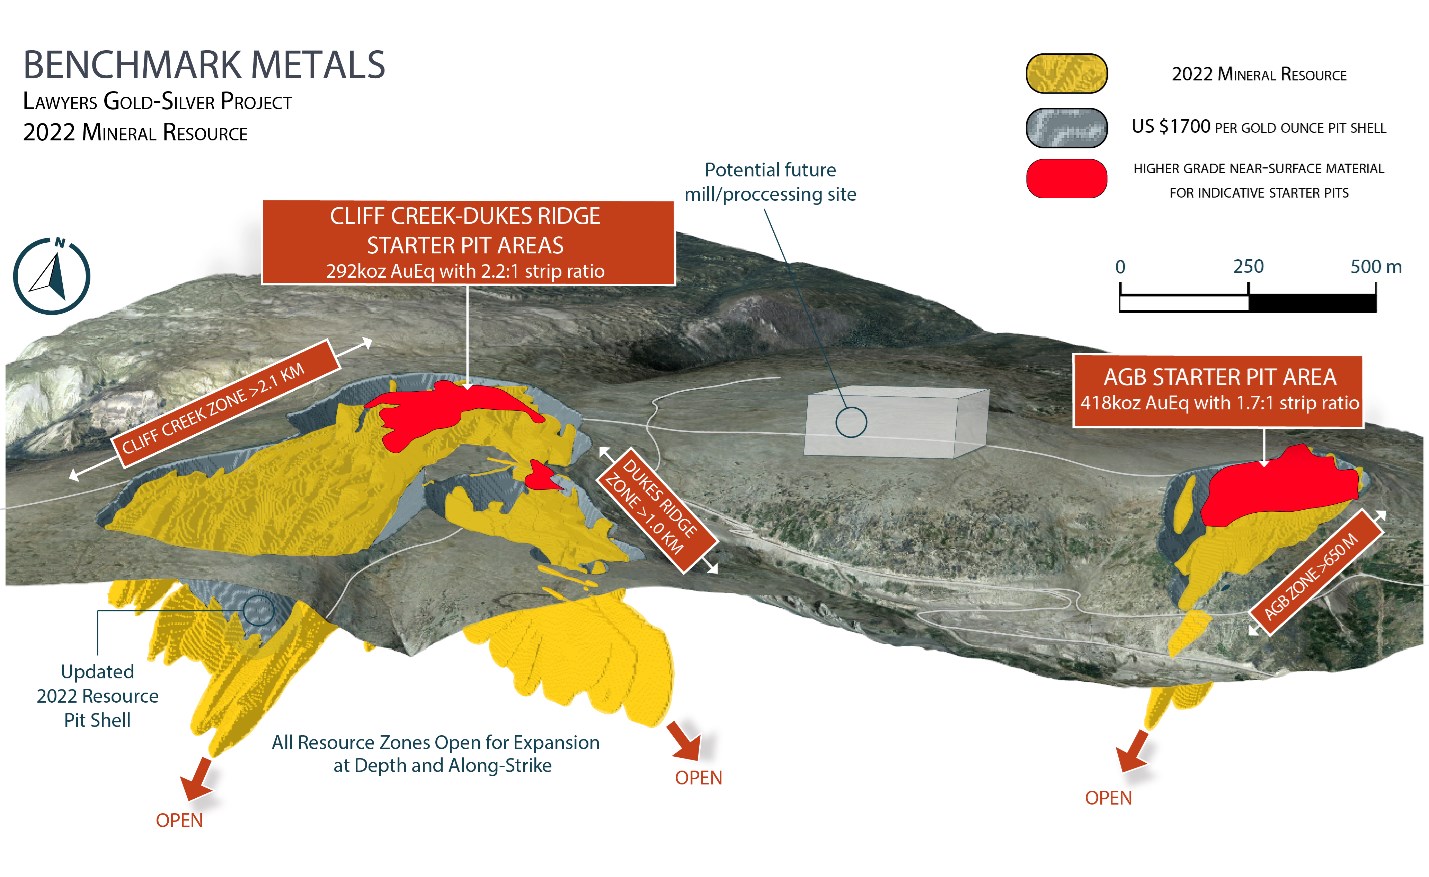
- High Grade Zones – Indicative Starter Pits with higher-grade;
- Cliff Creek and Dukes Ridge deposits show 5.2 million tonnes at 1.74 g/t AuEq for approximately 292,000 oz AuEq at a preliminary strip ratio of 2.2:1
- AGB deposit 7.5 million tonnes at 1.74 g/t AuEq for approximately 418,000 oz AuEq at a preliminary strip ratio of 1.7:1
- Strip ratios – Overall OP preliminary strip ratio for the full MRE is 5.6:1 for CC-DR and 2.9:1 for AGB;
- The MRE will form the basis of a Preliminary Economic Assessment (PEA) to be completed in Q3, 2022;
- All of the zones remain open for further expansion, and;
- The Project holds multiple satellite targets for discoveries and additional gold-silver mineralization.
Table #1: Lawyers Expanded Mineral Resource Estimate (1-9)
| Pit Constrained Mineral Resource Estimate @ 0.4 g/t AuEq Cut-Off | ||||||||
| Resource Area | Classification | Tonnes | Au | Ag | AuEq | Au | Ag | AuEq |
| k | g/t | g/t | g/t | k oz | M oz | k oz | ||
| Cliff’s Creek |
Measured & Indicated | 54,434 | 1.26 | 19.17 | 1.36 | 2,204 | 33.6 | 2,380 |
| Inferred | 2,114 | 1.03 | 12.98 | 1.08 | 70 | 0.9 | 74 | |
| AGB | Measured & Indicated | 11,373 | 1.05 | 43.93 | 1.60 | 384 | 16.1 | 584 |
| Inferred | 151 | 0.58 | 27.02 | 0.92 | 3 | 0.1 | 5 | |
| Total | Measured & Indicated | 65,807 | 1.22 | 23.45 | 1.40 | 2,587 | 49.6 | 2,964 |
| Inferred | 2,265 | 1.00 | 13.92 | 1.07 | 73 | 1.0 | 78 | |
| Out of Pit Mineral Resource Estimate @ 1.5 g/t AuEq Cut-Off | ||||||||
| Resource | Classification | Tonnes | Au | Ag | AuEq | Au | Ag | AuEq |
| k | g/t | g/t | g/t | k oz | M oz | k oz | ||
| Cliff’s Creek |
Measured & Indicated | 1,158 | 3.49 | 55.55 | 3.80 | 130 | 2.1 | 141 |
| Inferred | 2,302 | 3.88 | 65.46 | 4.26 | 287 | 4.8 | 315 | |
| AGB | Measured & Indicated | 411 | 1.55 | 89.33 | 2.66 | 20 | 1.2 | 35 |
| Inferred | 306 | 1.83 | 33.5 | 2.25 | 18 | 0.3 | 22 | |
| Total | Measured & Indicated | 1,569 | 3.00 | 66.65 | 3.54 | 150 | 3.2 | 177 |
| Inferred | 2,608 | 3.66 | 62.80 | 4.06 | 305 | 5.2 | 337 | |
| Total Mineral Resource Estimate @ 0.4 g/t and 1.5 g/t AuEq Cut-Off | ||||||||
| Resource | Classification | Tonnes | Au | Ag | AuEq | Au | Ag | AuEq |
| k | g/t | g/t | g/t | k oz | M oz | K oz | ||
| All | Measured & Indicated | 67,376 | 1.26 | 24.39 | 1.45 | 2,738 | 52.9 | 3,141 |
| Inferred | 4,873 | 2.39 | 39.41 | 2.63 | 378 | 6.2 | 415 | |
Notes:
- Mineral Resources that are not Mineral Reserves do not have demonstrated economic viability.
- The estimate of Mineral Resources may be materially affected by environmental, permitting, legal, title, taxation, socio-political, marketing, or other relevant issues.
- The Inferred Mineral Resource in this estimate has a lower level of confidence than that applied to an Indicated Mineral Resource and must not be converted to a Mineral Reserve. It is reasonably expected that the majority of the Inferred Mineral Resource could potentially be upgraded to an Indicated Mineral Resource with continued exploration.
- The Mineral Resources were estimated in accordance with the Canadian Institute of Mining, Metallurgy and Petroleum (CIM), CIM Standards on Mineral Resources and Reserves, Definitions (2014) and Best Practices Guidelines (2019) prepared by the CIM Standing Committee on Reserve Definitions and adopted by the CIM Council.
- Historical mined areas were removed from the block modelled resources.
- Metal prices used were US$1,750/oz Au and US$20/oz Ag and 0.78 US$ICDN$ FX with process recoveries of 90% Au and 83% Ag. A C$14.50/t process cost and C$5/t G&A cost were used. The Au:Ag ratio was 80:1.
- The constraining pit optimization parameters were C$3.15/t mineralized and waste material mining cost and 50° pit slopes with a 0.30 g/t AuEq cut-off.
- The Out-of-Pit Mineral Resource grade blocks were quantified above the 1.5 g/t AuEq cut-off, below the constraining pit shell and within the constraining mineralized wireframes. Out-of-Pit Mineral Resources selected exhibited continuity and reasonable potential for extraction by the long hole underground mining method.
- A new NI 43-101 technical report will not be produced as the total tonnage or total contained metal have not materially changed. An NI 43-101 technical report will be produced with updated Mineral Resources in conjunction with a PEA.
Figure 1:Â Plan map of the deposits with higher-grade core zones
Table #2: Sensitivity using various AuEq cut-off grades and gold prices (1-9)
| Global Measure & Indicated | |||||||
| Cutoff AuEq ppm | Tonnes | Avg Au ppm | Avg Ag ppm | Avg AuEq ppm | Au oz | Ag oz | AuEq oz |
| 0.20/1.5 | 99,483,000 | 0.94 | 18.14 | 1.08 | 3,004,100 | 58,011,800 | 3,443,600 |
| 0.30/1.5 | 81,834,000 | 1.09 | 21.11 | 1.25 | 2,871,100 | 55,549,000 | 3,293,900 |
| 0.35/1.5 | 74,107,000 | 1.08 | 21.34 | 1.35 | 2,583,600 | 50,842,100 | 3,219,100 |
| 0.4/1.5 | 67,376,000 | 1.26 | 24.39 | 1.45 | 2,737,500 | 52,866,900 | 3,140,500 |
| 0.5/1.5 | 56,205,000 | 1.44 | 27.78 | 1.65 | 2,595,800 | 50,190,600 | 2,979,700 |
| 0.6/1.5 | 47,762,000 | 1.61 | 31.09 | 1.84 | 2,464,900 | 47,733,900 | 2,831,100 |
| Global Inferred | |||||||
| 0.2/1.5 | 6,396,000 | 1.90 | 30.99 | 2.09 | 391,500 | 6,372,400 | 430,000 |
| 0.3/1.5 | 5,615,000 | 2.14 | 34.82 | 2.35 | 385,600 | 6,286,700 | 423,600 |
| 0.35/1.5 | 5,193,000 | 2.29 | 37.30 | 2.51 | 381,500 | 6,228,000 | 419,200 |
| 0.4/1.5 | 4,873,000 | 2.39 | 39.41 | 2.63 | 377,700 | 6,187,000 | 415,400 |
| 0.5/1.5 | 4,368,000 | 2.64 | 43.40 | 2.91 | 371,000 | 6,094,600 | 408,100 |
| 0.6/1.5 | 4,046,000 | 2.81 | 46.33 | 3.09 | 365,700 | 6,026,300 | 402,400 |
Figure #2:Â Resource expansion with de-risked, higher quality gold & silver ounces
Indicative Starter Pits
‘Indicative Starter Pits’ are provided within two of the deposits with higher-grade Mineral Resources located at surface. The AGB Deposit contains 7.5 million tonnes at 1.74 g/t AuEq for approximately 418,000 oz AuEq at a strip of 1.7:1. A second Starter Pit at the Cliff Creek Deposit has generated 5.2 million tonnes at 1.74 g/t AuEq for approximately 292,000 oz AuEq at a strip of 2.2:1. The ‘Starter Pits’ provide high quality mineralization with an expected low strip ratio at surface that has generated clean sulphide mineralogy free of deleterious elements with 93% gold metallurgical recovery. The Starter Pits contain lower strip ratios that result in mining less total material to generate improved economics in the initial years of mining.
Additional Mineral Resource Expansion Potential
Ongoing drilling is focused on open extensions of near surface, high-grade mineralization. Recent results, that were not included in the MRE are providing additional Mineral Resource expansion potential in several key areas including Dukes Ridge and Cliff Creek Mid. The Dukes Ridge Deposit recently generated positive results yielding 54.60 metres of 2.51 grams per tonne (g/t) gold and 97.05 g/t silver or 3.73 g/t AuEq, including 9.60 m of 13.39 g/t gold and 480.26 g/t silver or 19.39 g/t AuEq (see June 2, 2022Â news release). The deepest holes drilled at Dukes Ridge to date have extended mineralization, which remains open to nearly 300 metres vertical depth. In addition, the 20 kilometre long mineralized trend has provided clusters for multiple satellite deposits that require drill testing for additional new discoveries and Mineral Resource growth.
Near-Term Advancement to Mining
The historical mining footprint has logistical and structural advantages set within the mining district featuring access to highway, abundant and low-cost hydroelectric green power, fresh water, labour and in a Tier 1 mining jurisdiction that has proven world-class mines. Benchmark anticipates completion of the Preliminary Economic Assessment (PEA) during Q3, 2022. The Company has already completed significant progress with the PEA and includes recent metallurgical test work reconfirming an industry standard processing flowsheet with gold achieving 93% recovery. The Company has received initial geochemistry static test work for environmental analysis of waste rock and mineralized rock. To date, mineralized rock and waste analysis show insignificant and benign impacts to the environment. The majority of engineering work is completed, pending optimization of the mine plan and schedule. The PEA mine schedule will include the at surface, Starter Pit areas of higher-grade gold and silver mineralization and lower associated strip ratios. The core zones and initial starter pit areas have potential to positively impact the initial years of mining in the PEA.
The majority of engineering tasks to support development of the Feasibility Study (“FS”) are in progress or complete. Significant outstanding activities include on-going geotechnical work for major infrastructure, and geochemical test work. Additional work has focused on mine optimization and trade-off studies to determine robust economics and engineering efficiencies.
Measured and Indicated Classification
Benchmark has de-risked the gold and silver ounces by elevating the quality of the total Mineral Resource to the Measured and Indicated classification. The term “Measured & Indicated Mineral Resource” refers to that part of a Mineral Resource for which quantity, grade or quality, densities, shape and physical characteristics can be estimated with a level of confidence sufficient to allow the appropriate application of technical and economic parameters to support mine planning and evaluation of the economic viability of the deposit. The estimate is based on drill holes that are spaced closely enough for geological and grade continuity to be reasonably assumed. The new MRE is at a sufficient classification to be utilized in the Feasibility Study for 2023.
Quality Assurance and Control
Results from samples were analyzed at ALS Global Laboratories (Geochemistry Division) in Vancouver, Canada (an ISO/IEC 17025:2017 accredited facility). The sampling program was undertaken by Company personnel under the direction of Rob L’Heureux, P.Geol. A secure chain of custody is maintained in transporting and storing of all samples. Gold was assayed using a fire assay with atomic emission spectrometry and gravimetric finish when required (+10 g/t Au). Analysis by four acid digestion with 48 element ICP-MS analysis was conducted on all samples with silver and base metal over-limits being re-analyzed by atomic absorption or emission spectrometry. Rock chip samples from outcrop/bedrock are selective by nature and may not be representative of the mineralization hosted on the project.
The technical content of this news release has been reviewed and approved by Michael Dufresne, M.Sc, P.Geol., P.Geo., and Eugene Puritch, P.Eng., FEC, CET both Qualified Persons as defined by National Instrument 43-101. Mr. Puritch, President of P&E Mining Consultants Inc., is independent of Benchmark.
About Benchmark Metals
Benchmark Metals Inc. is a Canadian based gold and silver exploration and development company advancing its 100% owned Lawyer’s Gold-Silver Project located in the prolific Golden Horseshoe of northern British Columbia, Canada. The Project consists of three mineralized deposits that remain open for expansion, in addition to +20 new target areas along the 20-kilometre trend. The Company trades on the TSX Venture Exchange in Canada, the OTCQX Best Market in the United States, and the Tradegate Exchange in Europe. Benchmark is managed by proven Mineral Resource sector professionals, who have a track record of advancing exploration projects from grassroots scenarios through to production.
ON BEHALF OF THE BOARD OF DIRECTORS
s/ “John Williamson”
John Williamson, Chief Executive Officer
For further information, please contact:
Jim Greig
Email:Â jimg@BNCHmetals.com
Telephone: +1 604 260 6977
NEITHER TSX VENTURE EXCHANGE NOR ITS REGULATION SERVICES PROVIDER (AS THAT TERM IS DEFINED IN THE POLICIES OF THE TSX VENTURE EXCHANGE) ACCEPTS RESPONSIBILITY FOR THE ADEQUACY OR ACCURACY OF THIS RELEASE.
This news release may contain certain “forward-looking statements”. Forward-looking statements involve known and unknown risks, uncertainties, assumptions and other factors that may cause the actual results, performance or achievements of the Company to be materially different from any future results, performance or achievements expressed or implied by the forward-looking statements. Any forward-looking statement speaks only as of the date of this news release and, except as may be required by applicable securities laws, the Company disclaims any intent or obligation to update any forward-looking statement, whether as a result of new information, future events or results or otherwise.


