
How soil sampling can lead to the discovery of gold deposits
By Danae Voormeij, M.Sc., P.Geo.
For a gold exploration geologist, soil geochemistry is the most important and critical phase in making grassroots gold discoveries. Chemical analysis of soil samples can tell us the presence of gold and other metals in the rocks below. A high concentration of gold in soil can indicate a gold mine waiting to be found, and areas devoid of gold in soil can be eliminated and help reduce claim areas in size.
Soil exists worldwide, and on the Moon, and on Mars. Soil overlies bedrock and plants and trees grow in soil. Rainwater passes through the soil into the bedrock to recharge groundwater aquifers. Oxygen and CO2 from the air are carried with the rainwater, making the soil pH a bit acidic, which speeds up the rock weathering processes. As the rocks deteriorate below the surface, their mineral components break down into elemental form and are released into the overlying soils. This is termed residual. Hence, residual (as opposed to transported) soils carry a similar geochemistry to the rocks below, and any gold, copper or lithium that is hosted within the bedrock will show up in the soil geochemical analysis.
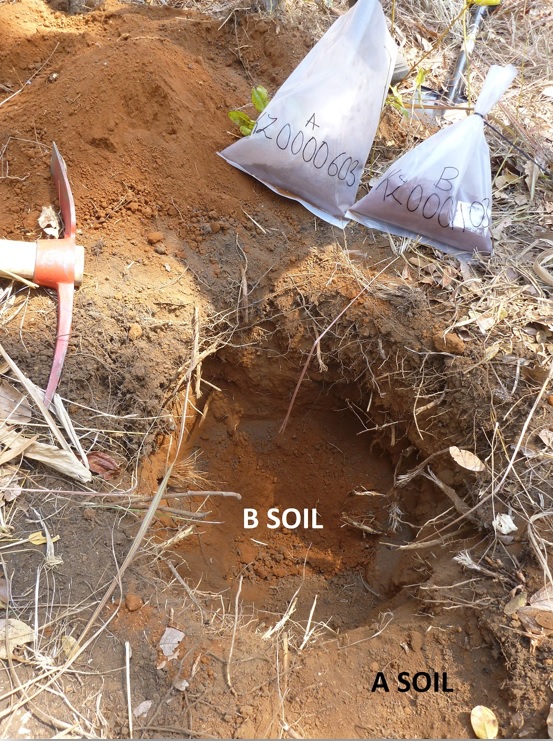
 Soils are stratified; have you ever dug a pit in the backyard and noticed the topsoil ‘band’ in the pit is darker than the rest of the pit? Or found dry, gravelly soil in the base of the pit? Simply put, the surface soil, where vegetation exists, is called the O soil. Directly beneath the surface is the 2-10 centimetre-thick dark brown A soil that is organic and has many fine white-haired plant rootlets growing in it. Beneath the A soil is the B soil, which is usually targeted in soil sampling surveys because the B soil is a zone of accumulation, and the geochemistry of the B soil is most similar to that of the underlying bedrock.
Field geologists train technicians to recognize the different soil bands, to consistently sample the same soil type across the survey. This approach is more effective than systematically sampling at say a 20-centimetre depth because of the uneven nature of soils; in some areas the B soil may be deeper down than in other areas.
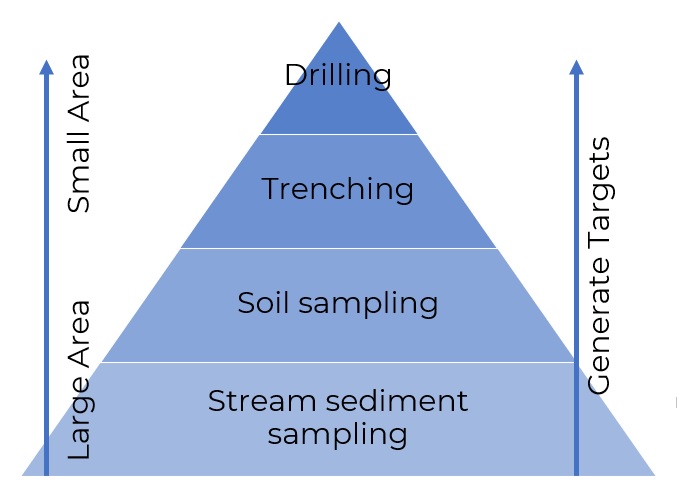
Stream sediment sampling is the most common first pass field survey, which can cover the entire claim at a density of 1 sample per square kilometre. Positive results, such as multiple sediment samples in one area that are anomalous for gold, will prompt a soil survey.
Rather than blanket the entire claim with soil sampling surveys (that is costly!), a focused approach is recommended – one that follows up on stream sediment anomalies or identifies favourable lithologies (ex. permeability of rock type may play a role), structures, or geological setting (ex. the way some rock types were folded together and fractured or sheared).
Companies with gold projects at tropical latitudes, such as Central America, West, East and Central Africa, Southeast Asia and South Pacific, will most likely have artisanal gold mining activities on their claims, and these (often illegal) gold mine locations can be vectors for soil geochemistry target areas.
Soil surveys typically have shorter point distance (40 metres apart) than soil line distance (100 metres apart). This is because gold systems are often long and thin in plan view (ex. A vein that is 300 metres long and 5 metres wide). To increase the chances of intersecting a gold vein, soil lines are wider spaced and soil point stations are spaced closely together.
In shear-zone hosted gold systems, the main shear zone is first identified and target areas for soil surveys are then designed perpendicular to this shear trend. That is because gold mineralization will most likely be hosted subparallel to the main shear trend.
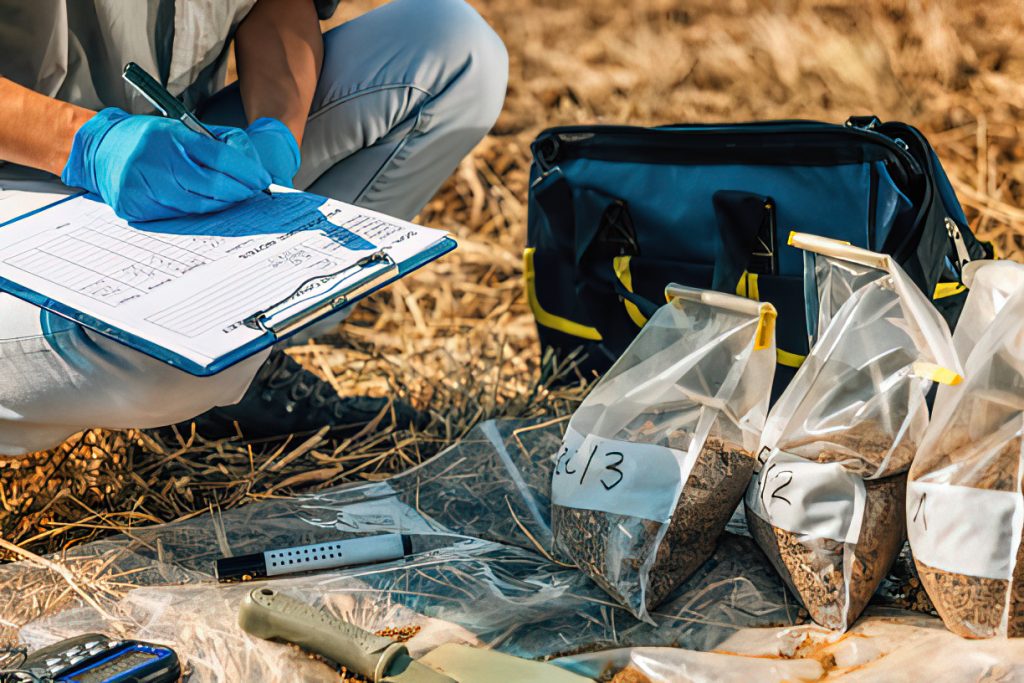
Soil samples are bagged and on average weigh 500 grams to 2 kilograms each. Soil samples are dried and crushed and then reduced in size to about 100 to 150 grams. Some companies have their own preparation process facility at their project site, which can save a lot of money on (1) transport and shipment of large samples to the lab and (2) crushing of samples.
On average, a 25-gram soil sample will cost $70 to get analyzed for gold and multi-element data. Lab turnaround time for results may be as long as three months during busy seasons.
The single soil point gold values are then gridded using basic software techniques such as Inverse Distance Weighting, or IDW, where the software searches from the point outwards radially for another data point and averages out the value between the data points within the radius. This grid is the gold in soil map that is commonly used to present results.
Note that gold in soil anomalies may be translocated down a slope, which is why it is important to also analyze the soil sample for multi-elemental data, as some elements associated with gold, such as tellurium, titanium and tungsten, are highly residual and can help identify gold in soil dispersion patterns and better focus trench and drill targets.
Positive results from soil analysis, often in tandem with geophysics, such as a ground magnetic survey, drives drill targeting. Since a 200-metre-deep diamond drillhole can cost around $40,000, it is critical to place those drill collars in the best possible position to intersect gold mineralization at depth.
 A sizeable, positive bulls-eye anomaly for gold in soil is either trenched next or drilled directly, or both. Trenchwork is enormously valuable as a dataset. Trenchwork is effectively a horizontal drill hole when sampled by applying QAQC, and mapped systematically and similarly to logging and sampling of drill core. Labour intensive, but trenching is much cheaper than a diamond core drill hole, so why not trench a lot in the soil target area and give work to the locals?
Here is an example of a 2.4-million-ounce gold deposit I discovered with 553 soils, in Liberia for Hummingbird Resources. Local artisanal gold mining prompted the soil grid location. Soil lines were spaced 200 metres apart, sample stations 40 metres apart. The B soil was sampled. The nearby Dugbe Shear Zone trends northeast and soil lines were placed perpendicular to this shear trend. Samples were shipped to ALS laboratory for crushing, grinding, splitting and 25-gram samples were put in Aqua Regia digest and resulting liquid analyzed for gold and 46 multi-elements by ICP MS.
The resulting positive gold in soil anomaly, defined as greater than 250 ppb gold in soil, is 1.7 km in length and 400 metres in width, and was trenched and drilled into a 2.4-million-ounce resource grading 1.2 g/t gold.
Soil sampling increases the chances of finding a gold deposit by generating drill and trench targets, while lowering exploration risks for a project.