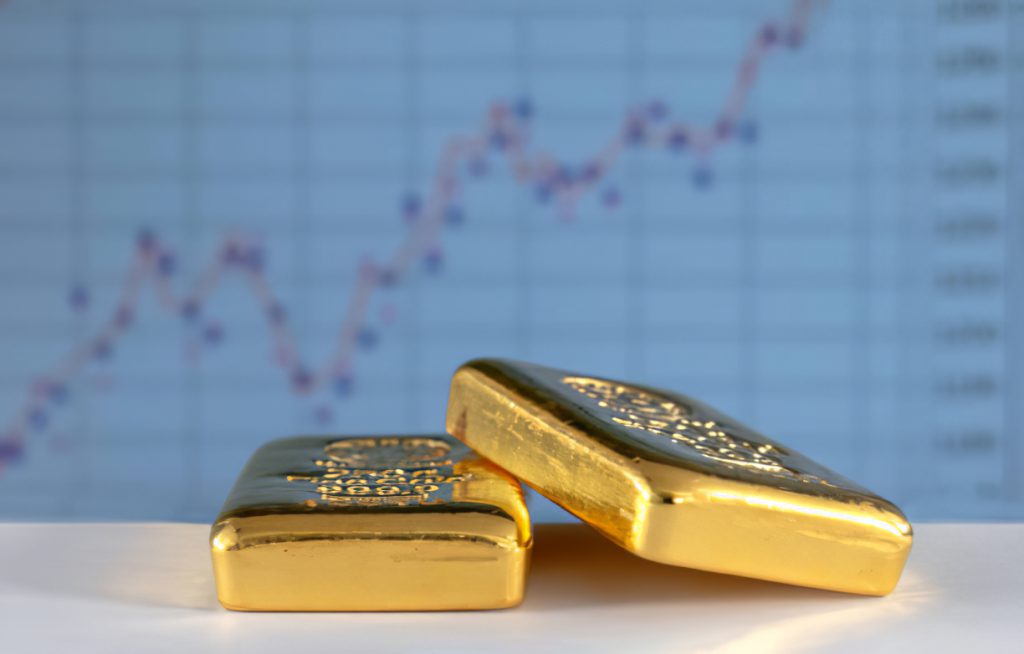
Gold and silver price charts depicting ‘Flag formation’  Â

On the cusp – flag formations can predict either a sharp rise or sudden drop
By Rod Blake
If you are an investor in resource stocks, then the first and a half months of 2020 have been very kind to you, especially so if your portfolio has been over-weighted to the gold/silver sector.
I don’t know the exact numbers, but I’m pretty sure that other than the high flying technology sector, the gold/silver sector has been the top performing market segment so far this year. This year alone, the price of gold bullion has climbed from about US$1,520/oz to establish a new record high of about US$2,070 and is currently at about US$1,900 for a gain to date of some 25%.
Silver has done even better – climbing over 40% to a current US$$25/oz. Similarly, the TSX Venture Exchange – the exchange that most closely mirrors the commodity issuers – has climbed from about 586 to a two-year high of 754 in early September and is currently at about 715 – an increase of about 22%.
All of this after the price of gold and silver fell by some 11% and 38%, respectively, and the Venture Exchange plummeted by about 40% in March during the onset of the Covid-19 pandemic and resulting stock market crash that followed. To make these gains in such an uncertain year has certainly been quite remarkable. When I was a broker, I used to cringe at the thought of the summer months as the Venture Exchange more times than not went into a ‘Summer Doldrums’ induced correction that often gave up most of the year’s earlier gains. This year – not so much.
The question now, of course, is where the market goes from here? Are these gains sustainable? Has the market peaked and now going lower or is there more upside to come? Let’s take a closer look.
The price of gold, silver and by inference the TSX Venture Exchange all had good starts to the year, sold off in the Covid-19 crisis and have subsequently reached new recent highs. All have pulled back somewhat from those highs and now seem to be trading – as seen in the Venture Exchange – in a nail-biting sideways pattern.
But where the Venture has been range-bound for most of September, the charts of gold and silver are remarkably different. Where the Venture steadily rose and formed a plateau top, gold and silver both moved sharply higher since mid-summer and are now forming what looks to be very distinct and similar ‘Flag’ formations.
Flag formations are important in that they are usually formed with a sharp rise in price followed by a relatively short congestion period that can lead to another sharp rise or a sudden drop in price. Gold and silver both made remarkable gains in July through August to form their flagpoles and in the last month or so seem to be forming their subsequent flags. What is really interesting is that this is the second flag formation for both gold and silver in the past few months. Both formed very similar patterns in early May and both dramatically broke out above the highs of their flagpoles to set their new highs of August. That is the intrigue of flag formations – the magnitude of moves out of the flag – either to the upside or the downside.
What is the outlook for resource stocks from here? Time will tell but first the markets have to digest and hold the year’s gains to date. Gold and silver have had a stellar year. Copper has reached a multi-year high of US$3.11/lb and crude oil seems to holding around US$40/barrel – all of which is positive for resource investors. September through November can be very choppy for equity markets. This fall, with a possible second wave of Covid-19 and a U.S. Presidential election looming, may make the next few months extremely volatile. Locking in some well-earned profits is never a wrong decision to make.
Longer term, the future for resource investors still seems bright. The momentum that drove the technology stocks to record highs seems to be waning and that money has to go somewhere – perhaps some to the resource sector. The world is coming to terms with the trillions of Covid-19 induced dollars that the central banks have injected into the economy, and that should be positive for hard assets such as precious metals. Meanwhile, government sponsored infrastructure projects should benefit base metals and increased economic activity can’t but help the very depressed petroleum market.
Most importantly, keep an eye on those gold and silver charts. Their flag patterns seem to forming in the equal winds of uncertainty and opportunity. We’ve already witnessed the power of this pattern earlier this year. If history repeats and they break to the upside once again, then we could see moves that are greater in magnitude from what we saw previously. If they break to the downside – look for buying opportunities going into the New Year. The flags are up and the wind is blowing. The next few months will be very interesting indeed.
